Elevating Business Data with the Four Blocks Bar Chart
You’re likely familiar with bar charts—standard, effective, but sometimes a bit uninspired. What if you could convey comparative data with a design that captures attention and communicates not just numbers, but concepts? That’s where the Four Blocks Bar Chart enters the scene. It’s a visual tool designed specifically for business data that transforms a standard bar into four distinct, often color-coded segments within each column. This isn't just about aesthetics; it's a practical framework for adding layers of information or a creative twist to foundational data.
Beyond Simple Percentages: The Core Idea
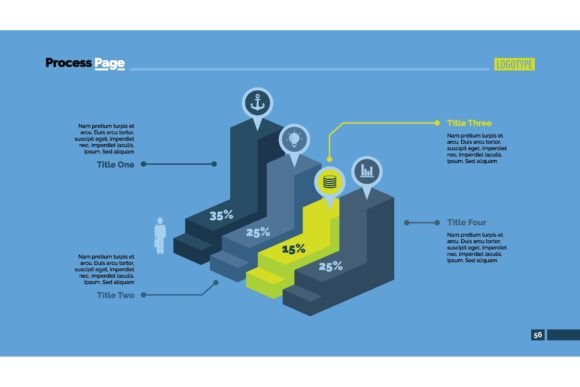
The Four Blocks Bar Chart cleverly uses the space inside a traditional bar. Imagine you need to show a total sales figure for a quarter. A normal bar chart does that well. But with a four-block design, that same bar can be internally segmented—perhaps to show the contribution from four different regions, product lines, or sales channels within that total. It visually nests a secondary dataset inside the primary one, or it can be used purely stylistically to break a single value into equal parts, adding graphic weight and modernity. This approach moves beyond simple percentages and diagrams to incorporate a creative concept directly into the analysis.
Real-World Scenarios: Where This Chart Truly Shines
Consider a marketing manager preparing a year-end review. Instead of using five separate bars for five campaigns, she uses one bar for the total marketing budget, segmented into four blocks representing spend on digital, print, events, and partnerships. The height shows the total, the internal colors show the mix. The audience instantly grasps both scale and allocation.
A startup founder pitching to investors can use a Four Blocks Bar Chart to represent projected market growth. Each bar for different years is split into four blocks symbolizing four core customer acquisition strategies. It tells a story of planned resource distribution over time, making the financial forecast more tangible and strategy-focused.
Adapting to Different Audiences and Industries
The utility of this tool stretches across sectors because business data is universal, but the need to present it compellingly varies.
- Finance & Accounting: Here, precision is key. An analyst might use it to break down a company’s revenue into four major geographic segments within each annual bar. It provides a clear, at-a-glance view of regional contribution trends over several years, adding depth to standard financial charts in reports.
- Consulting & Strategy: Consultants thrive on clear, persuasive visuals. Using the Four Blocks Bar Chart to deconstruct a client’s problem—for instance, showing a bar for "Total Customer Churn" split into four root-cause categories—can powerfully frame a discussion and lead directly to the proposed solutions for each block.
- Education & Non-Profit: When presenting funding utilization or program outcomes to donors, a dry pie chart might not engage. Showing a bar for "Total Funds Raised" divided into four blocks for program areas makes the data more approachable and visually aligns with the narrative of diversified impact.
- Internal Communications: For HR sharing employee survey results, a bar for "Overall Engagement Score" could be internally split into four blocks representing feedback on culture, compensation, growth, and work-life balance. It’s immediately more insightful than a single number.
How Different Users Extract Unique Value
A designer might lean heavily on the creative aspect, using the four-block structure to bring a bold, modern look to a website’s data visualization or an infographic, prioritizing the visual "hook." A data analyst will focus on its analytical capacity, ensuring each block’s proportion accurately represents a precise sub-value, using it as a nuanced comparative tool. A project manager might use it pragmatically in status presentations, where each project phase’s timeline bar is split into four key task groups, communicating progress and complexity simultaneously. The same Four Blocks Bar Chart serves these different needs by being both a functional data container and a design element.
Practical Considerations Before You Apply It
Like any tool, the Four Blocks Bar Chart has best-use scenarios. Before integrating it into your next presentation or report, a few considerations will ensure it hits the mark.
First, clarity is paramount. If you are using the blocks to represent actual sub-data, those segments must be clearly labeled, either with a legend or directly on the chart. Avoid making the viewer guess what each block means. Second, consider your data structure. It works beautifully for data that naturally has four components or where you can logically group sub-elements into four categories. Forcing a five-part dataset into four blocks would distort the message.
Also, think about color choice. Since there are four distinct elements within a single bar, using a harmonious but distinct color palette is crucial for quick differentiation. High contrast between blocks can sometimes look jarring; aim for a palette that is both varied and visually cohesive. Finally, acknowledge its primary strength: it’s excellent for showing a total and its composition side-by-side with other totals. It’s less ideal for showing tiny, precise differences between those internal blocks, as exact proportions can be hard to read within the bar’s height—a detailed table might still be needed for the finest granularity.
Infusing Professionalism and Creativity into Your Work
The ultimate benefit of adopting the Four Blocks Bar Chart is that dual injection of professionalism and creative flair. In a world saturated with generic slides and predictable reports, a well-executed version of this chart signals thoughtfulness. It shows you’ve considered not just what the data says, but how it will be understood and remembered. Whether you’re customizing a template, building an infographic, or delivering a critical report, this tool allows you to represent numerical data with an added layer of narrative or design intelligence. It turns a basic chart into a conversation piece, making your business data not just seen, but genuinely delved into.
By moving beyond conventional formats, you invite your audience to engage more deeply. They don't just consume a figure; they explore a structure. That shift—from passive reception to active interpretation—is where the Four Blocks Bar Chart proves its real value in the practical, daily world of business communication.